We live in a world of excellent EVFs (Electronic View Finders), zebras, and real-time highlight warnings. So why are some photographers—still checking histograms like it’s 2007?
Simple: because EVFs can lie. Histograms don’t.
What EVFs Do Well (and What They Don’t)
Electronic viewfinders today are bright, high-res, and incredibly responsive. They give you a What-You-See-Is-What-You-Get preview of exposure and color. And for 90% of use cases, that’s great. Composition, color feel, basic exposure judgment? The EVF does the job.
But in bright light or high-contrast scenes, EVFs can trick your eyes. You might think your shadows have detail when they don’t. Or you might not notice blown highlights until it’s too late. That false sense of confidence is exactly where the histogram steps in.
What a Histogram Actually Tells You
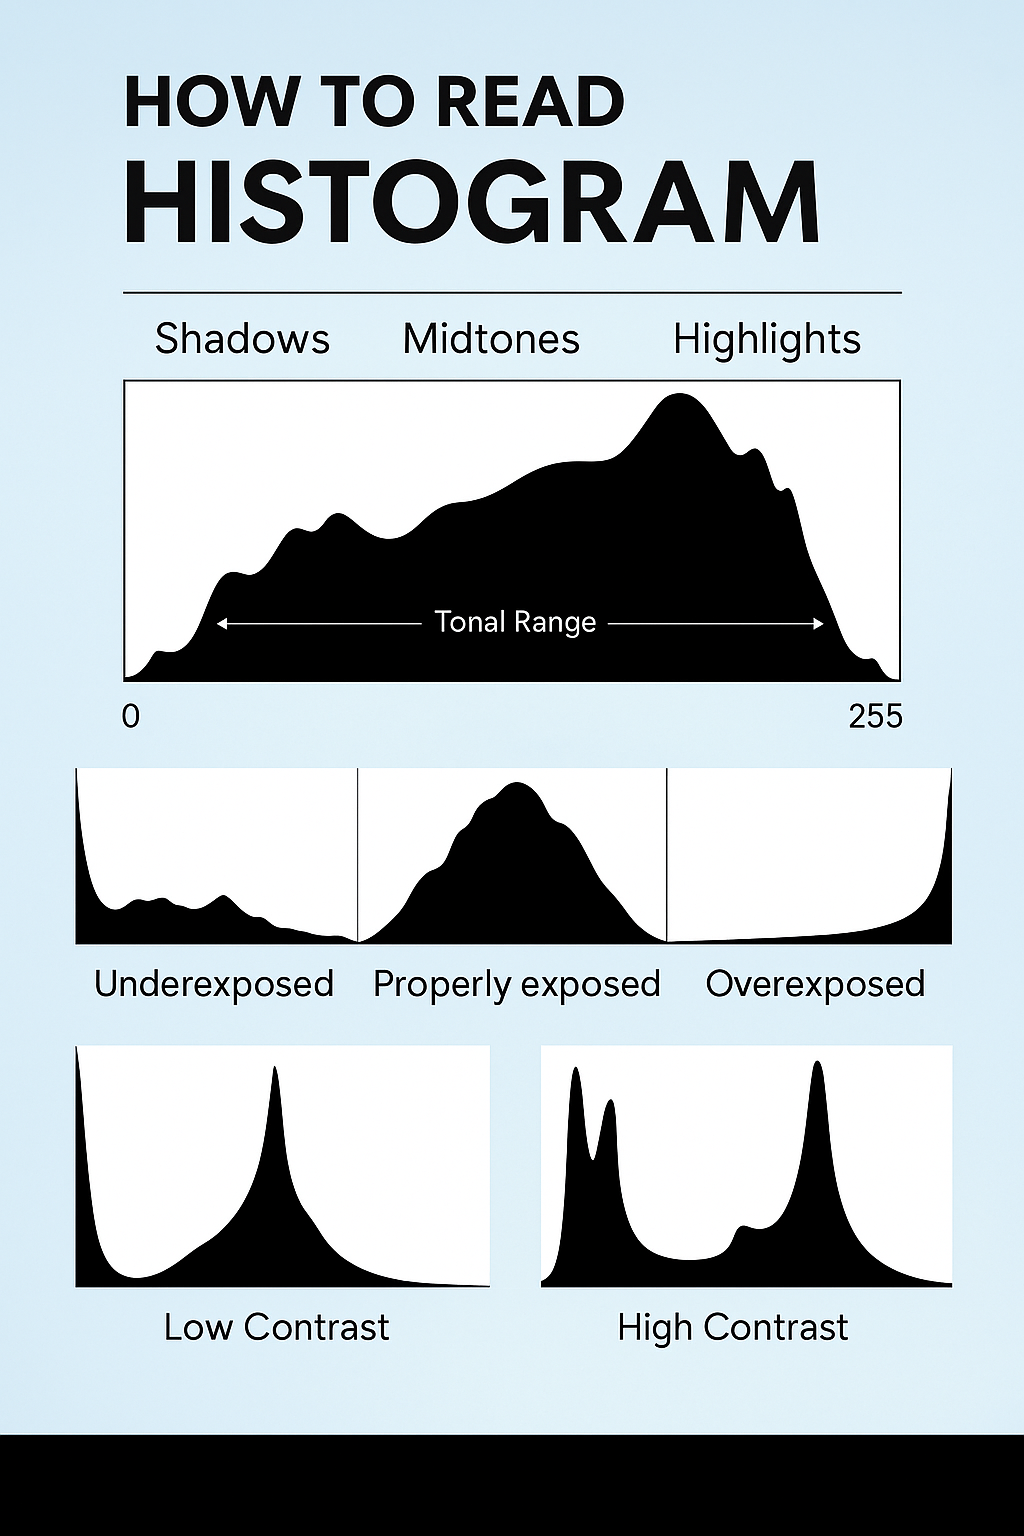
A histogram is a tonal map of your image. The left side represents shadows, the right side highlights, and the middle contains your mid-tones. The height of the graph at any point shows how many pixels fall into that brightness range.
The key thing? It’s objective. The histogram doesn’t care how bright your EVF looks or what your LCD is doing in the sun. It tells you, frame by frame, whether your photo is crushing blacks or clipping whites.
When Histograms Outperform EVFs
- Bright outdoor conditions: When your screen or EVF is washed out and you can’t trust your eyes.
- Shooting RAW for dynamic range: You want to push exposure to the right without blowing highlights.
- Backlit subjects: When you expose for the subject, but the background blows out.
- Flat profiles (V-Log, OM-Log, etc.): The EVF looks dull, but the histogram tells you if you’re nailing exposure.
In these moments, the histogram becomes more than a graph—it’s your safety net.
EVF, Zebras, Histogram: Use All Three
Think of it like this:
- EVF: Your creative eye
- Zebras: Your highlight warning system
- Histogram: Your global exposure truth
Use the EVF to compose. Use zebras to watch for hotspots. Use the histogram to validate the whole exposure map.
What to Look For in a Histogram
- No hard clipping left or right (unless intentional)
- A shape that matches your subject (e.g., high-key portraits will lean right)
- Avoiding “dead” zones unless stylistically intended

Reference the graphic above if you’re new to reading histogram shapes. It’s one of the fastest ways to assess exposure health in a shot.
Final Thoughts
EVFs are amazing tools. But they don’t replace the histogram—they complement it. A histogram doesn’t tell you if your photo is good, but it does tell you if it’s technically sound. And in a fast-paced, high-stakes shooting environment, that truth can save your best shot.
Next time you think you nailed it because your EVF looked perfect, double-check your histogram. It might just teach you something your eyes missed.